Use of optical remote sensing data for soil moisture monitoring
Soil moisture plays an essential role in the geo-hazard monitoring. High soil moisture can cause soil liquefaction, which can lead to other geo-hazards like, e.g., landslide and debris flow. High soil moisture has delayed effect on other geo-hazard, by knowing the soil moisture we can predict the potential hazard in advance and minimise it. Traditional methods, such as gravimetric method or applying soil moisture meter, are not suitable for measurement in hazardous areas like, e.g., mine tailings pond and landslide site. Remote sensing technology can solve this problem of data-capturing in hazardous areas. This research applies optical images and thermal images from Landsat as well as the Digital Elevation Model (DEM) data.
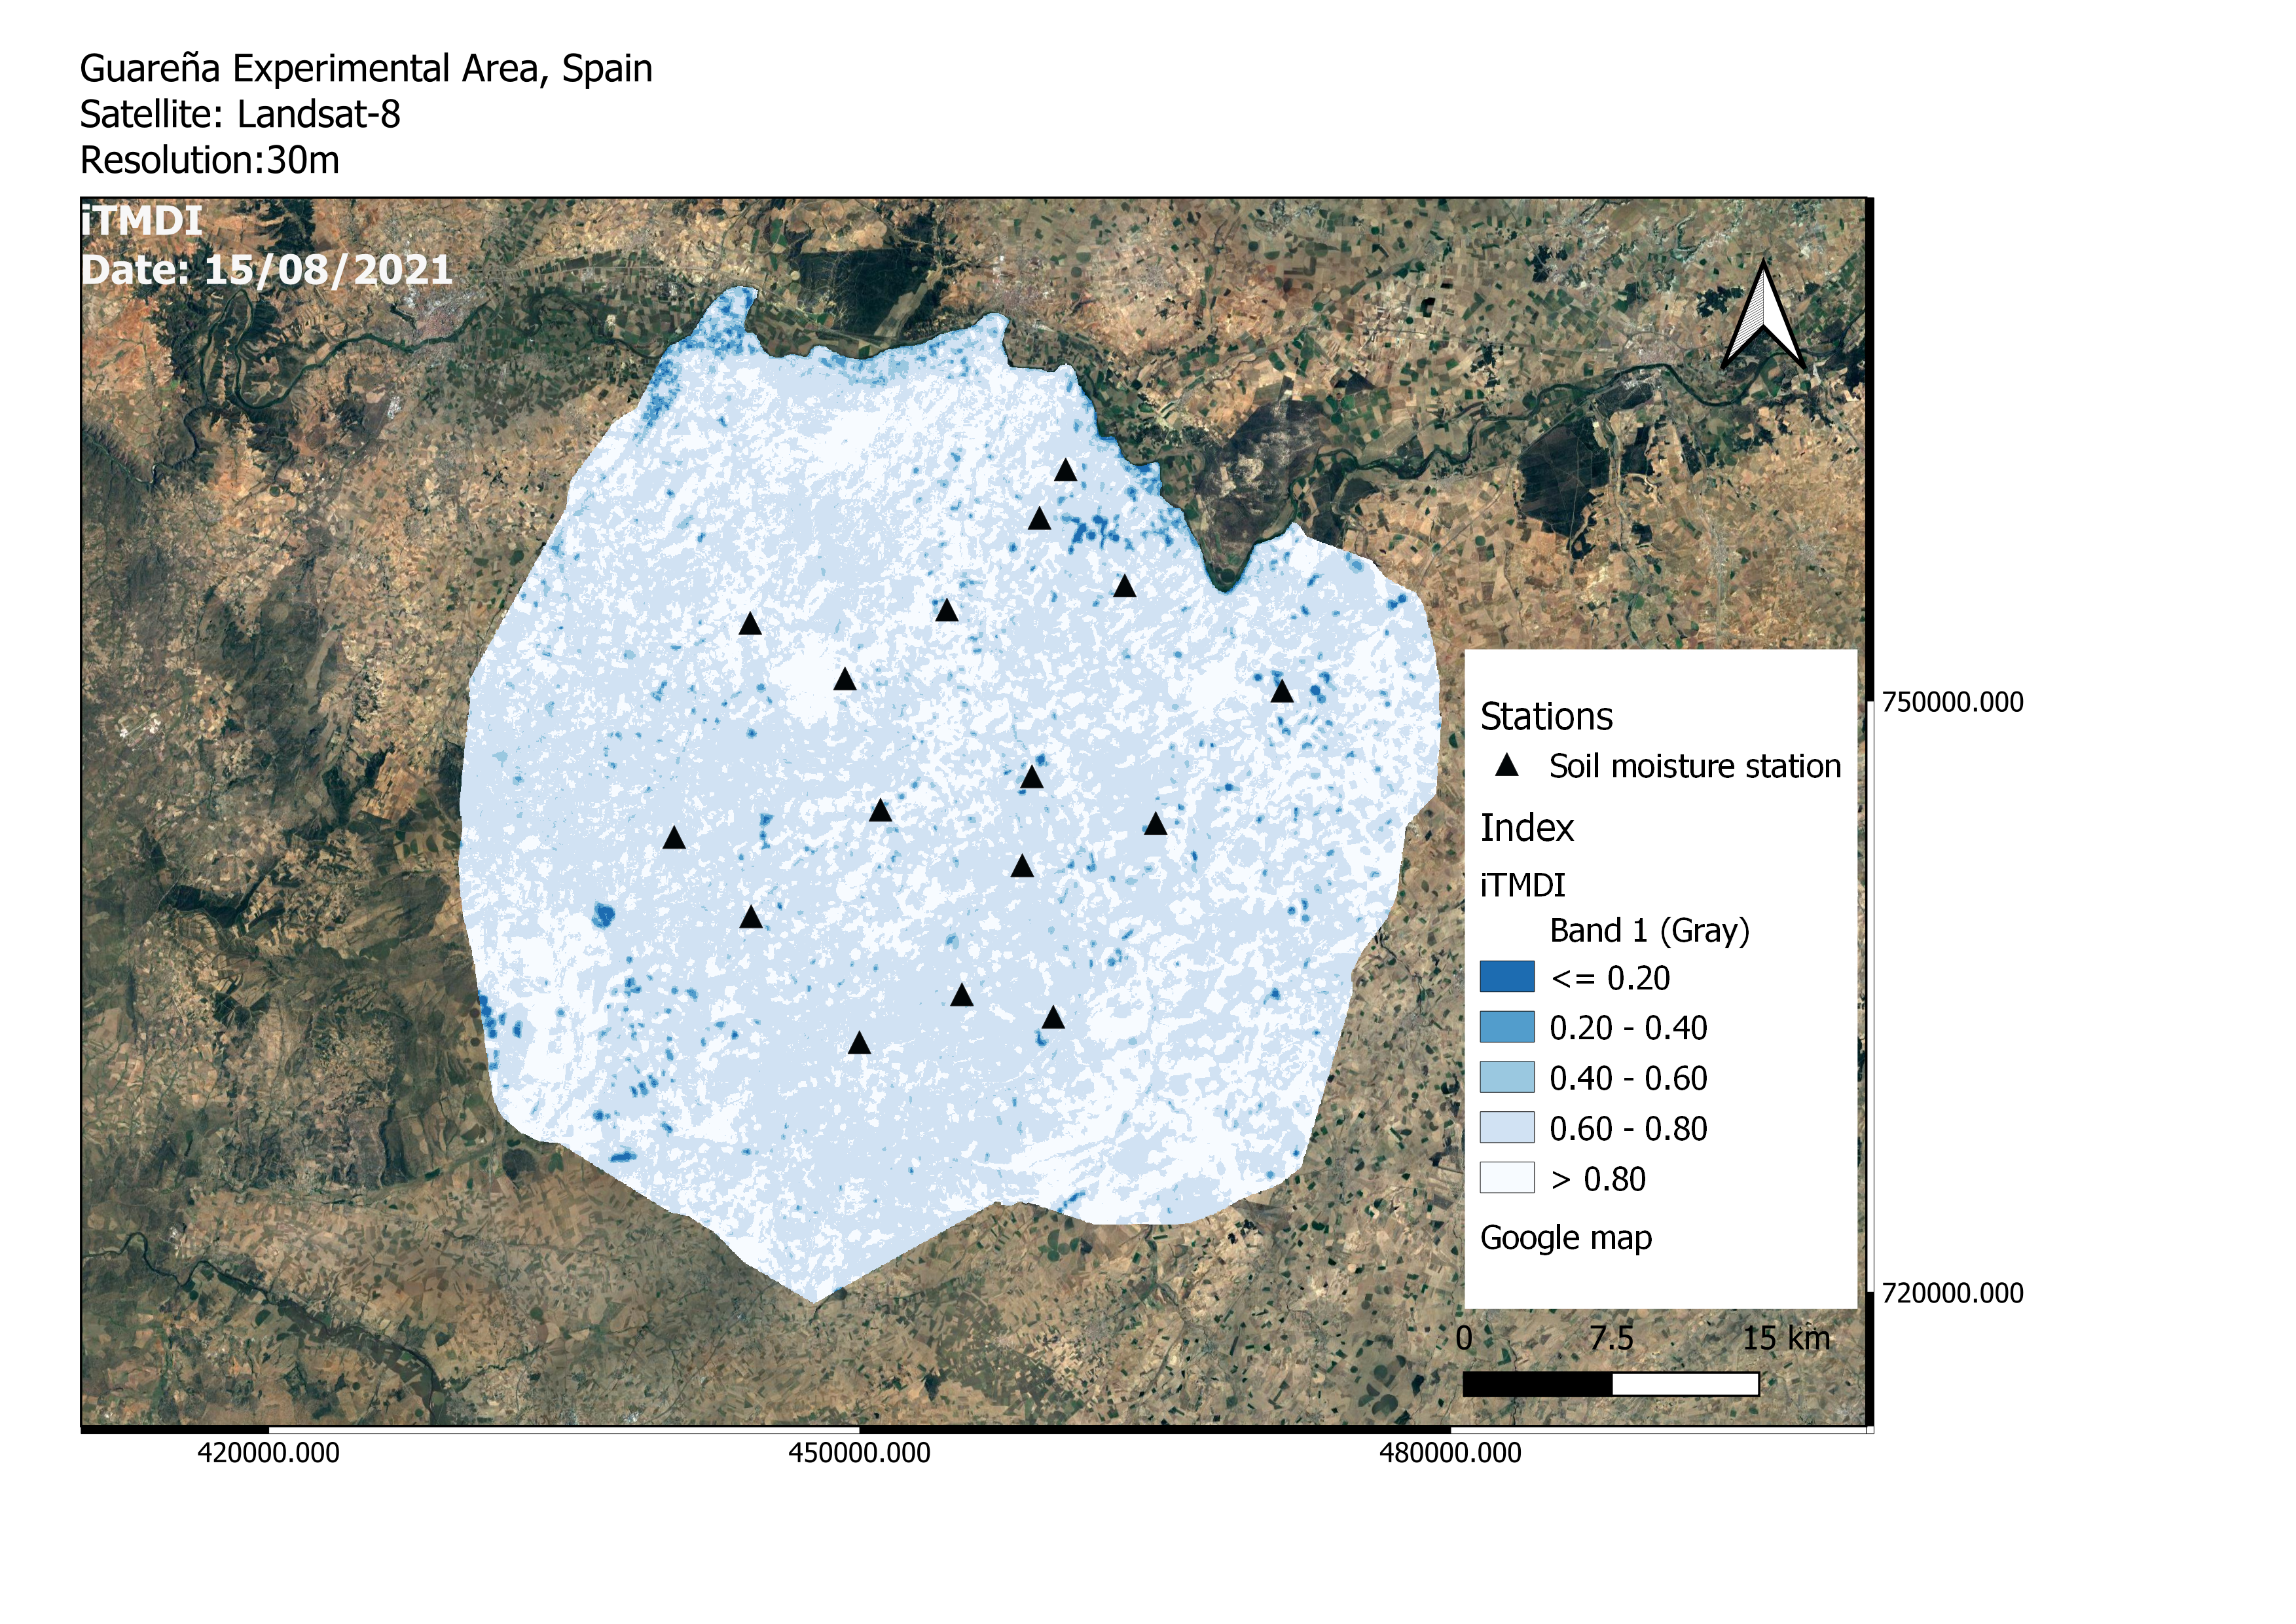
Soil moisture is connected with Land Surface Temperature (LST) and surface water availability. The new index improved-Temperature-Soil Moisture Dryness Index (iTMDI) reflects the relationship between surface water condition and variation of LST. Therefore, this study aims to use the iTMDI to quantify soil moisture. The DEM-Corrected LST and the Normalized Difference Latent Heat Index (NDLI) are used to generate NDLI-LST triangle space, where NDLI can represent the surface water condition. The index iTMDI is calculated based on the NDLI-LST triangle space. For validation of the obtained soil moisture measures is used ground-based in-situ soil moisture data of an exemplarily region in south Germany in Baden-Württemberg. This validation allows for an assessment of the accuracy of the indices iTMDI and Temperature-Vegetation Dryness Index (TVDI). According to the Land Use and Land Cover (LULC) classification, the relationship between iTMDI and LULC class will be discussed. The result shows that the index iTMDI can be a reliable and efficient indicator to represent the spatial distribution of the soil moisture.
